In the dynamic world of technical analysis, chart patterns serve as powerful tools for predicting price movements in financial markets. Among these patterns, the inverted cup and handle chart pattern is a widely recognized formation that can signal potential trend reversals.
In this informative article, we explore the intricacies of the inverted cup and handle chart pattern, its significance, and how traders and investors can identify and interpret this formation.
Table of Contents
Cup & Handle Chart Pattern
The Cup and Handle pattern is a classic and highly reliable chart pattern used by traders to identify potential opportunities for buying or shorting an asset. The pattern is considered bullish, indicating a possible upward price movement after the pattern is completed. The complete reverse of this is the reverse cup and handle pattern. Since we will be talking on the inverted pattern, let us focus in depth on it.
Inverted Cup & Handle Chart Pattern
The Inverted Cup and Handle, also known as the Reverse or Inverse Cup and Handle, is a bearish chart pattern that is commonly used in technical analysis for predicting potential price reversals in the market. It is essentially the upside-down version of the Cup and Handle pattern, identified by the legendary trader William J. O’Neil.
The anatomy of the Reverse Cup and Handle pattern mirrors the conventional Cup and Handle pattern but in the opposite direction. The pattern comprises two parts: the inverted ‘Cup’ and the inverted ‘Handle’.
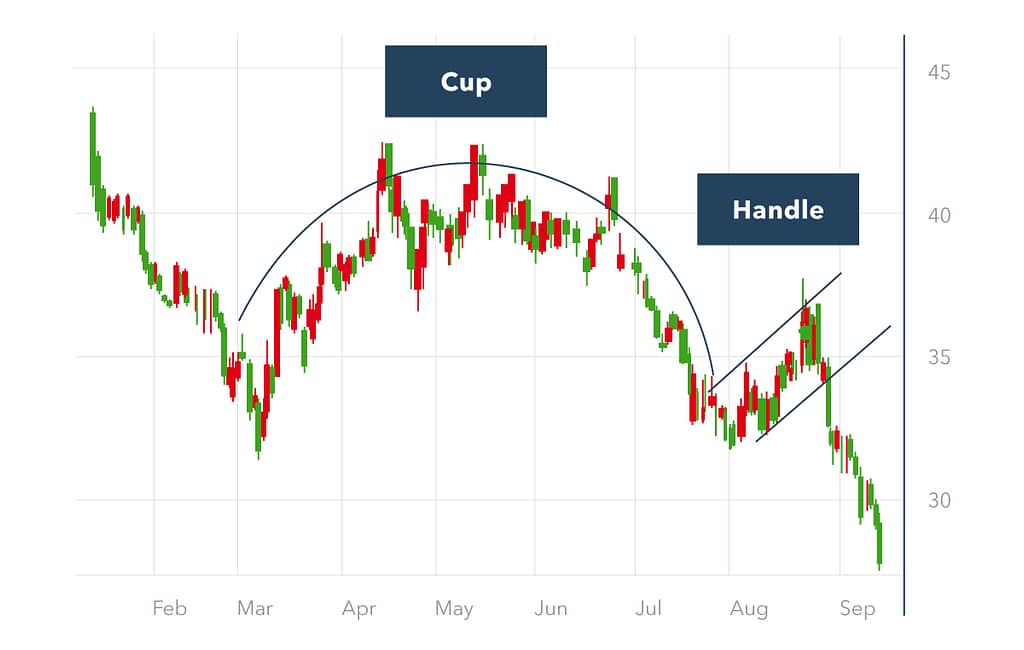
The Reverse Cup’ is a “U” or “V” shaped pattern that forms after a market decline. It’s a period of consolidation where the price either moves sideways or slightly upwards, before falling back down to the previous low. Unlike the bullish C&H, where a U-shaped cup is ideal, a Reverse C&H can take the form of a U or a V, with the latter often leading to sharper reversals.
Following the cup formation is the Reverse ‘Handle’. This appears as a smaller period of consolidation or a slight uptrend forming on the right side of the cup. This is generally seen as a breather or minor rally before a strong price drop.
The timeframe for the Reverse C&H pattern can range from a few days to a month. It’s important to note that the longer the pattern takes to form, the more significant the potential price movement could be. Volume tends to decrease during the formation of the C&H, and a sharp increase in volume as the price falls through the ‘handle’ is a strong bearish signal.
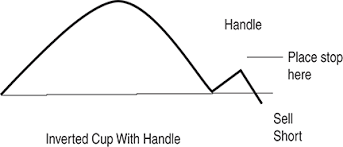
Setting a stop-loss level is vital when trading this pattern. Many traders set their stop-loss just above the top of the handle, limiting potential losses if the price unexpectedly rises instead of falling.
Profit targets are typically set by measuring the distance from the top of the cup to the bottom, also known as the depth of the cup, and subtracting this from the breakout point at the bottom of the handle. For instance, if the top of the cup is at $50 and the bottom is at $40, and the price breaks down at $42, the target would be $32 ($42 – $10).
However, despite its widespread usage, the Reverse Cup and Handle pattern has its limitations. One of the biggest challenges is that it can be easily misidentified, leading to false signals.
Importance of Reverse Cup & Handle Chart Pattern in Trading
Indicative of Bearish Market Sentiment
This pattern typically forms in a downtrend and is considered a bearish continuation pattern. This means that after the pattern is completed, the price of the asset is expected to continue moving downwards. This can be very useful for traders who are looking to take short positions or buy put options on crypto exchanges.
Potential for Significant Price Drops
The depth of the cup can be used to estimate the potential price drop after the breakout from the handle. This gives traders a potential target price for the asset, aiding in the planning of trades and risk management.
Volume Confirmation
The Reverse C&H pattern often involves a decrease in volume as the pattern forms, especially during the handle phase. A sharp increase in volume on the breakdown from the handle provides confirmation of the bearish pattern. This confirmation can increase a trader’s confidence in the predicted price movement.
Conclusion
In conclusion, the Reverse C&H Chart Pattern serves as a critical tool in the technical analyst’s toolkit, especially for predicting potential bearish reversals in the market. Its relevance lies in its ability to encapsulate market sentiment, provide price targets, assist in risk management, and help traders understand market dynamics.
Advice for Traders
1. Confirmation is Key: Wait for a proper breakout from the handle pattern before initiating a trade. A significant increase in trading volume at the point of breakout often provides a reliable confirmation signal.
2. Use Stop Losses: Like any trading strategy, it does not guarantee success. It is crucial to always set a stop loss to manage your risk. A commonly suggested place is just above the top of the handle.
3. Be Patient: This pattern can take some time to form. Do not rush to trade on the first sign of a pattern – let it fully form to increase the chances of a successful trade.
4. Combine with Other Indicators: Use other technical analysis tools such as trendlines, moving averages, RSI, or MACD to confirm the pattern and signal.
5. Consider the Broader Market Trend: Remember, the Reverse C&H is a bearish continuation pattern, so it’s most reliable in a downtrend. If the pattern forms during an uptrend, it may be less reliable.
6. Pattern Depth Matters: The depth of the cup in the Reverse C&H pattern can give you a sense of the potential price drop. However, this should be used as a guideline rather than a hard and fast rule.